MEM By The Numbers
The data below, collected from the School of Business's Career Office, the Career Center, and the university, provides a glimpse into the major, the students who choose MEM, and the success our graduates experience after their time at UConn.
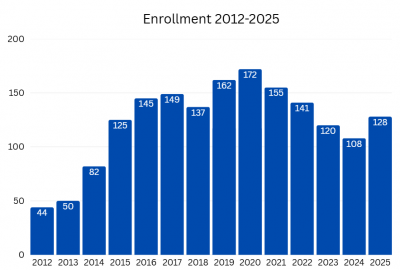
Enrollment Statistics

Mean and Median Starting Salary 2016-2023
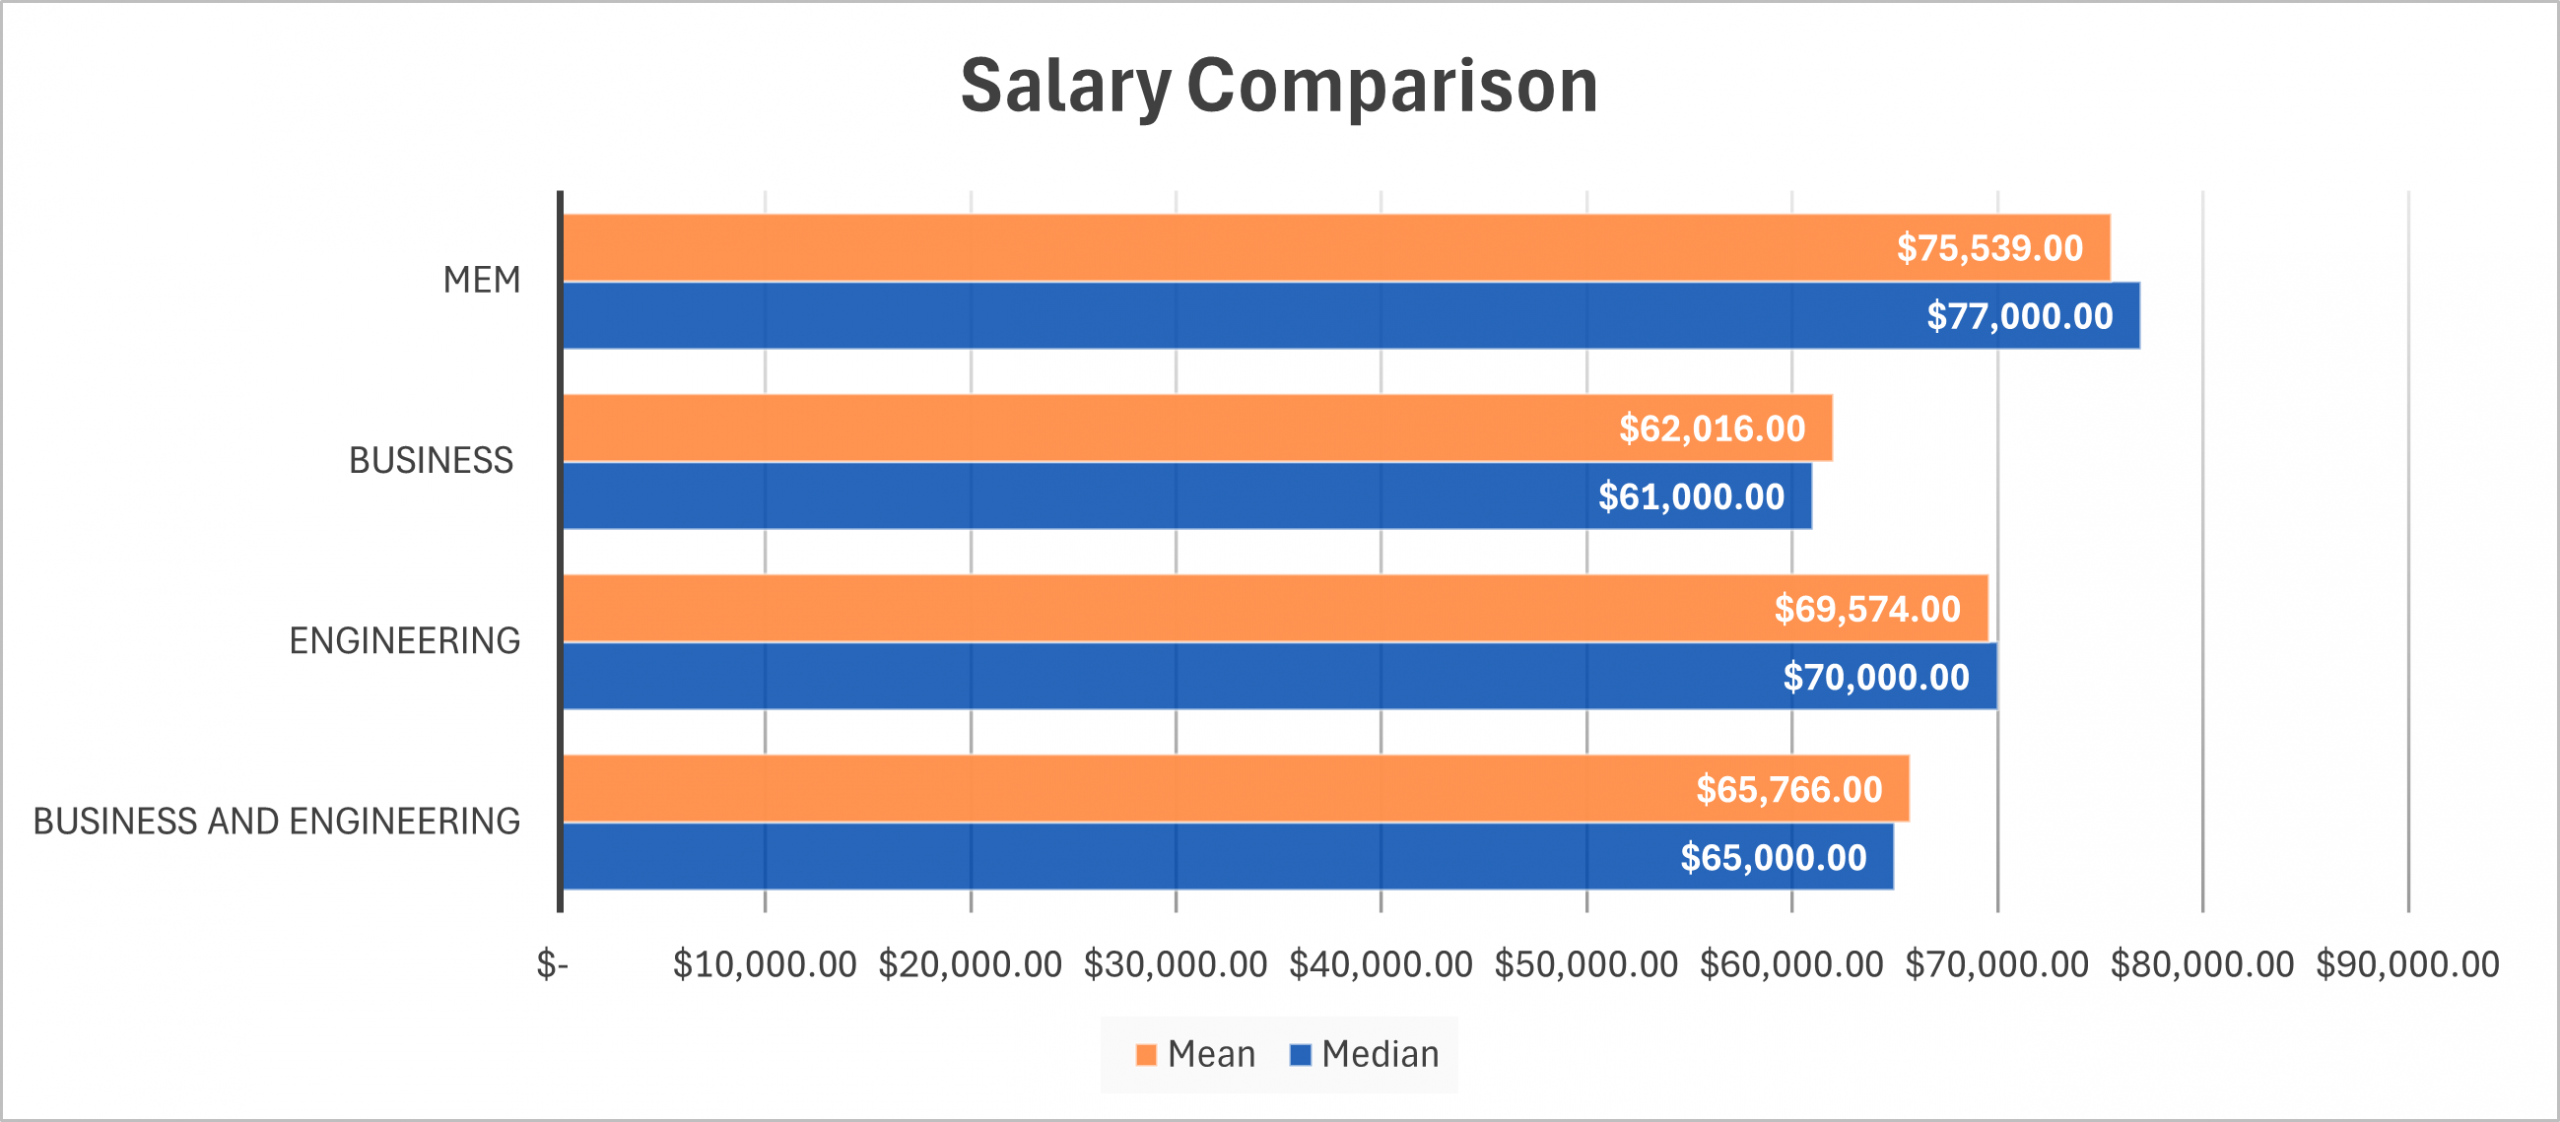
Graduates Starting Mean
MEM: $75,539
Engineering: $69,574
Business: $62,016
Business & Engineering: $65,766
Graduates Starting Median
MEM: $77,000
Engineering: $70,000
Business: $61,000
Business & Engineering: $65,000
Outcomes after 6 Months
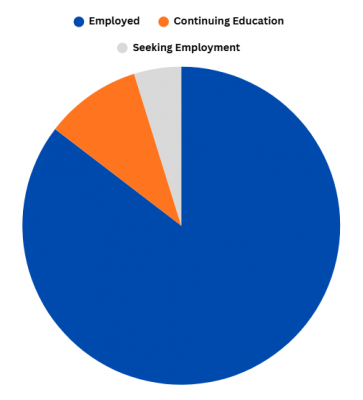
MEM Graduates at 6 Months
Employed: 85.4%
Continuing Education: 9.8%
Seeking Employment or Continuing Education: 4.8%